Visualize real-time sensor data from Azure IoT Hub using Power BI

[!NOTE] Before you start this tutorial, make sure you’ve completed Setup your device. By Setup your device, you set up your IoT device and IoT hub, and deploy a sample application to run on your device. The application sends collected sensor data to your IoT hub.
What you learn
You learn how to visualize real-time sensor data that your Azure IoT hub receives by Power BI. If you want to try visualize the data in your IoT hub with Web Apps, please see Use Azure Web Apps to visualize real-time sensor data from Azure IoT Hub.
What you do
- Get your IoT hub ready for data access by adding a consumer group.
- Create, configure and run a Stream Analytics job for data transfer from your IoT hub to your Power BI account.
- Create and publish a Power BI report to visualize the data.
What you need
- Tutorial Setup your device completed which covers the following requirements:
- An active Azure subscription.
- An Azure IoT hub under your subscription.
- A client application that sends messages to your Azure IoT hub.
- A Power BI account. (Try Power BI for free)
Add a consumer group to your IoT hub
Consumer groups are used by applications to pull data from Azure IoT Hub. In this lesson, you create a consumer group to be used by a coming Azure service to read data from your IoT hub.
To add a consumer group to your IoT hub, follow these steps:
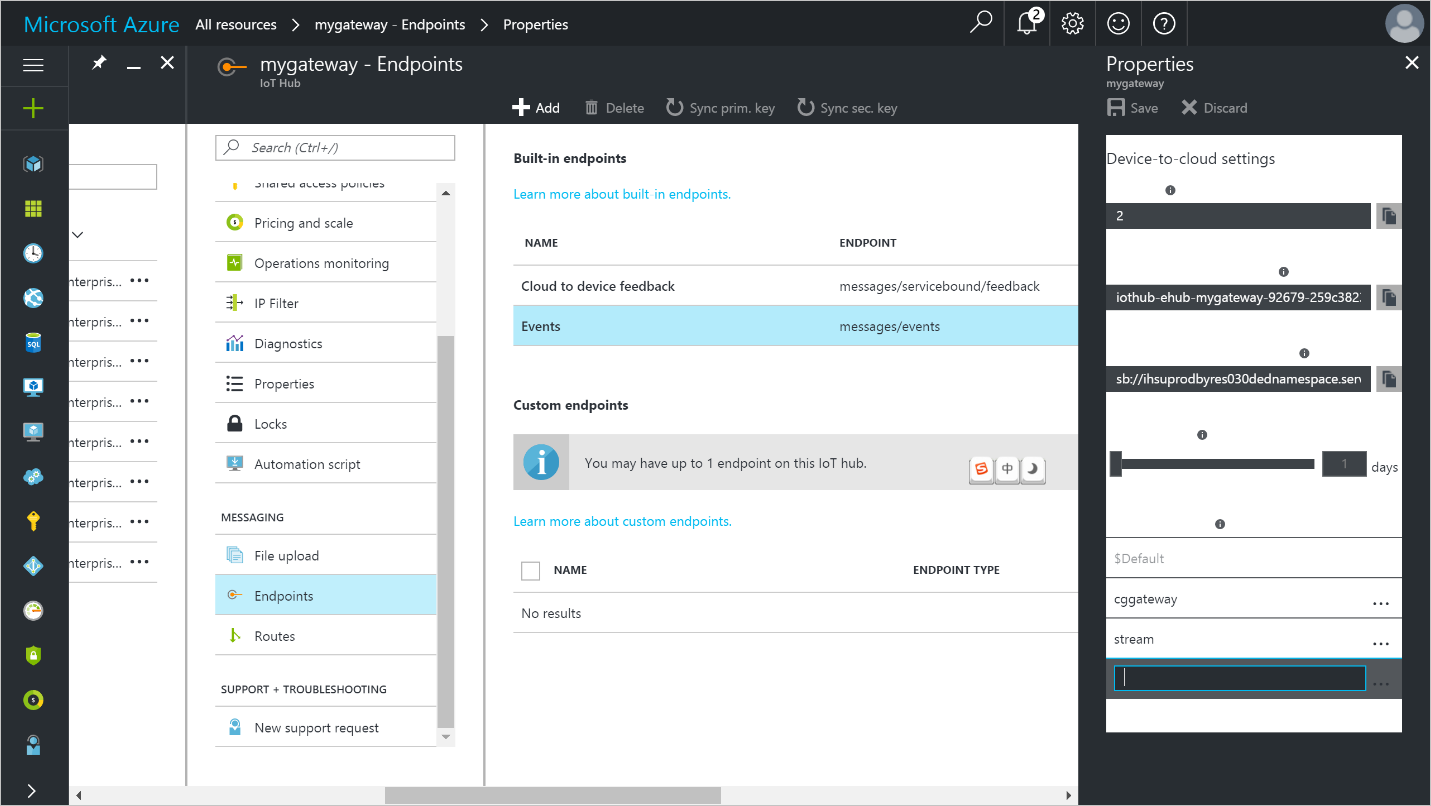
- In the Azure portal, open your IoT hub.
Click Endpoints on the left pane, select Events on the middle pane, enter a name under Consumer groups on the right pane, and then click Save.
Create, configure, and run a Stream Analytics job
Create a Stream Analytics job
- In the Azure portal, click New > Internet of Things > Stream Analytics job.
Enter the following information for the job.
Job name: The name of the job. The name must be globally unique.
Resource group: Use the same resource group that your IoT hub uses.
Location: Use the same location as your resource group.
Pin to dashboard: Check this option for easy access to your IoT hub from the dashboard.
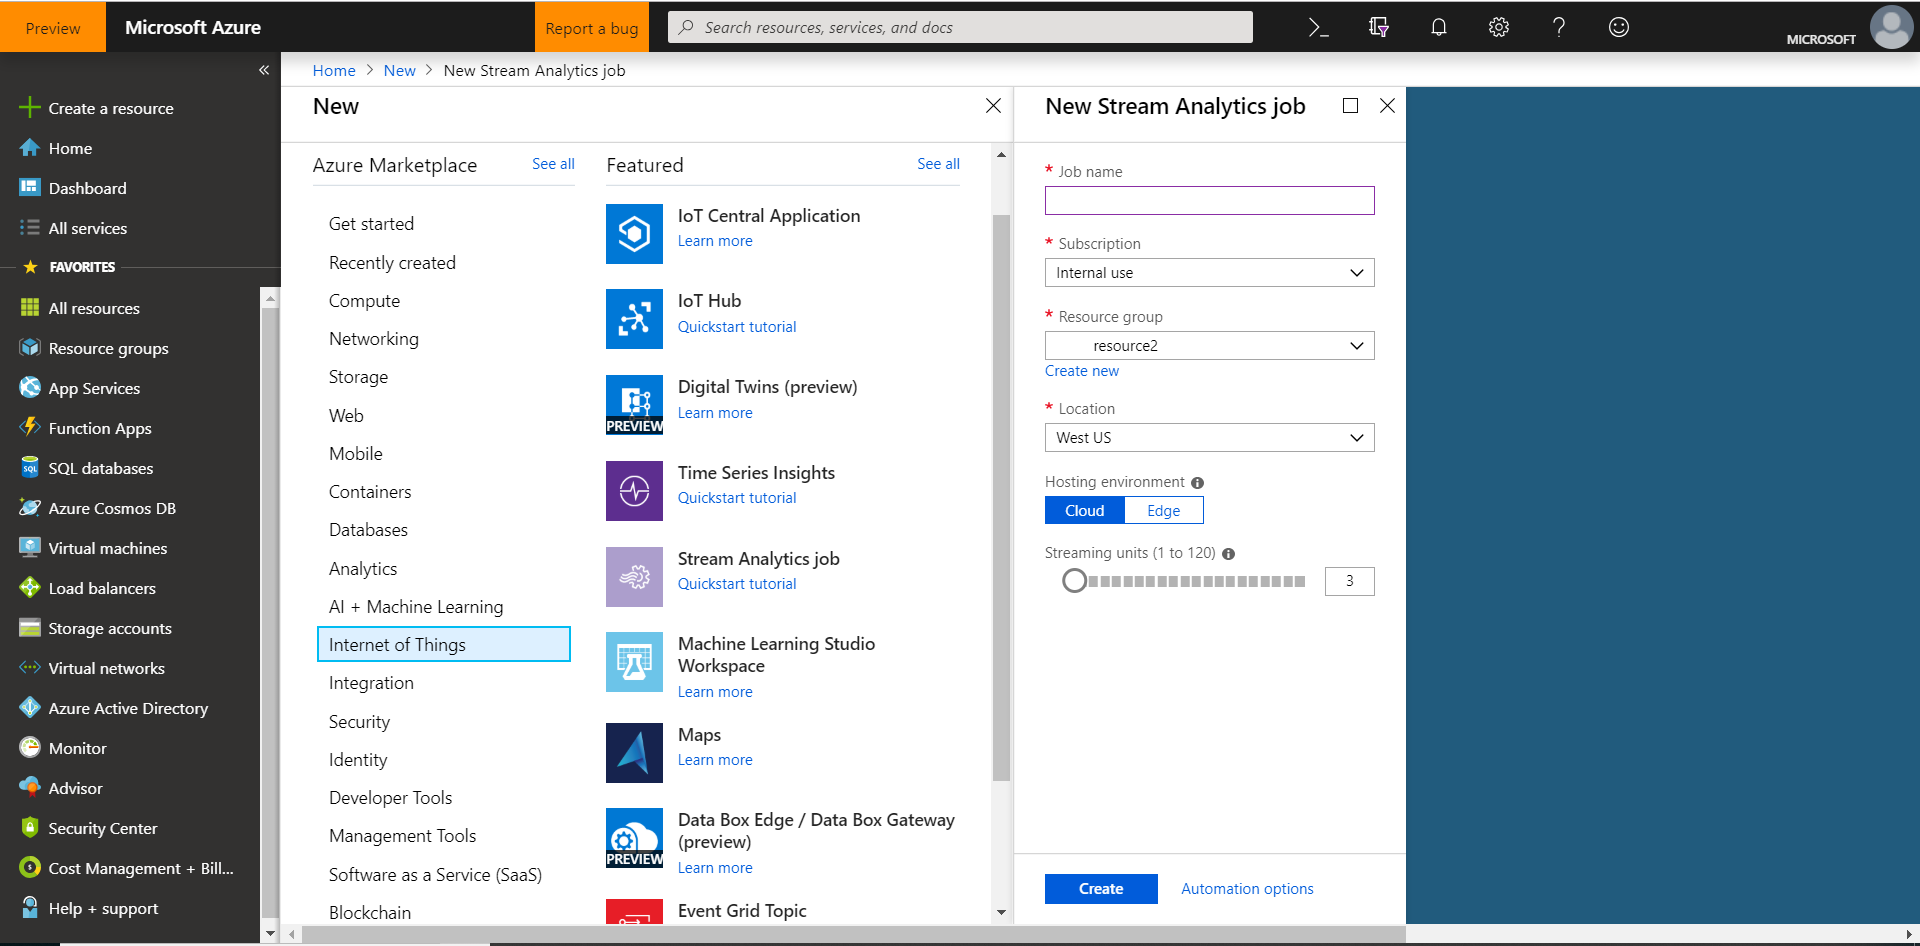
Click Create.
Add an input to the Stream Analytics job
- Open the Stream Analytics job.
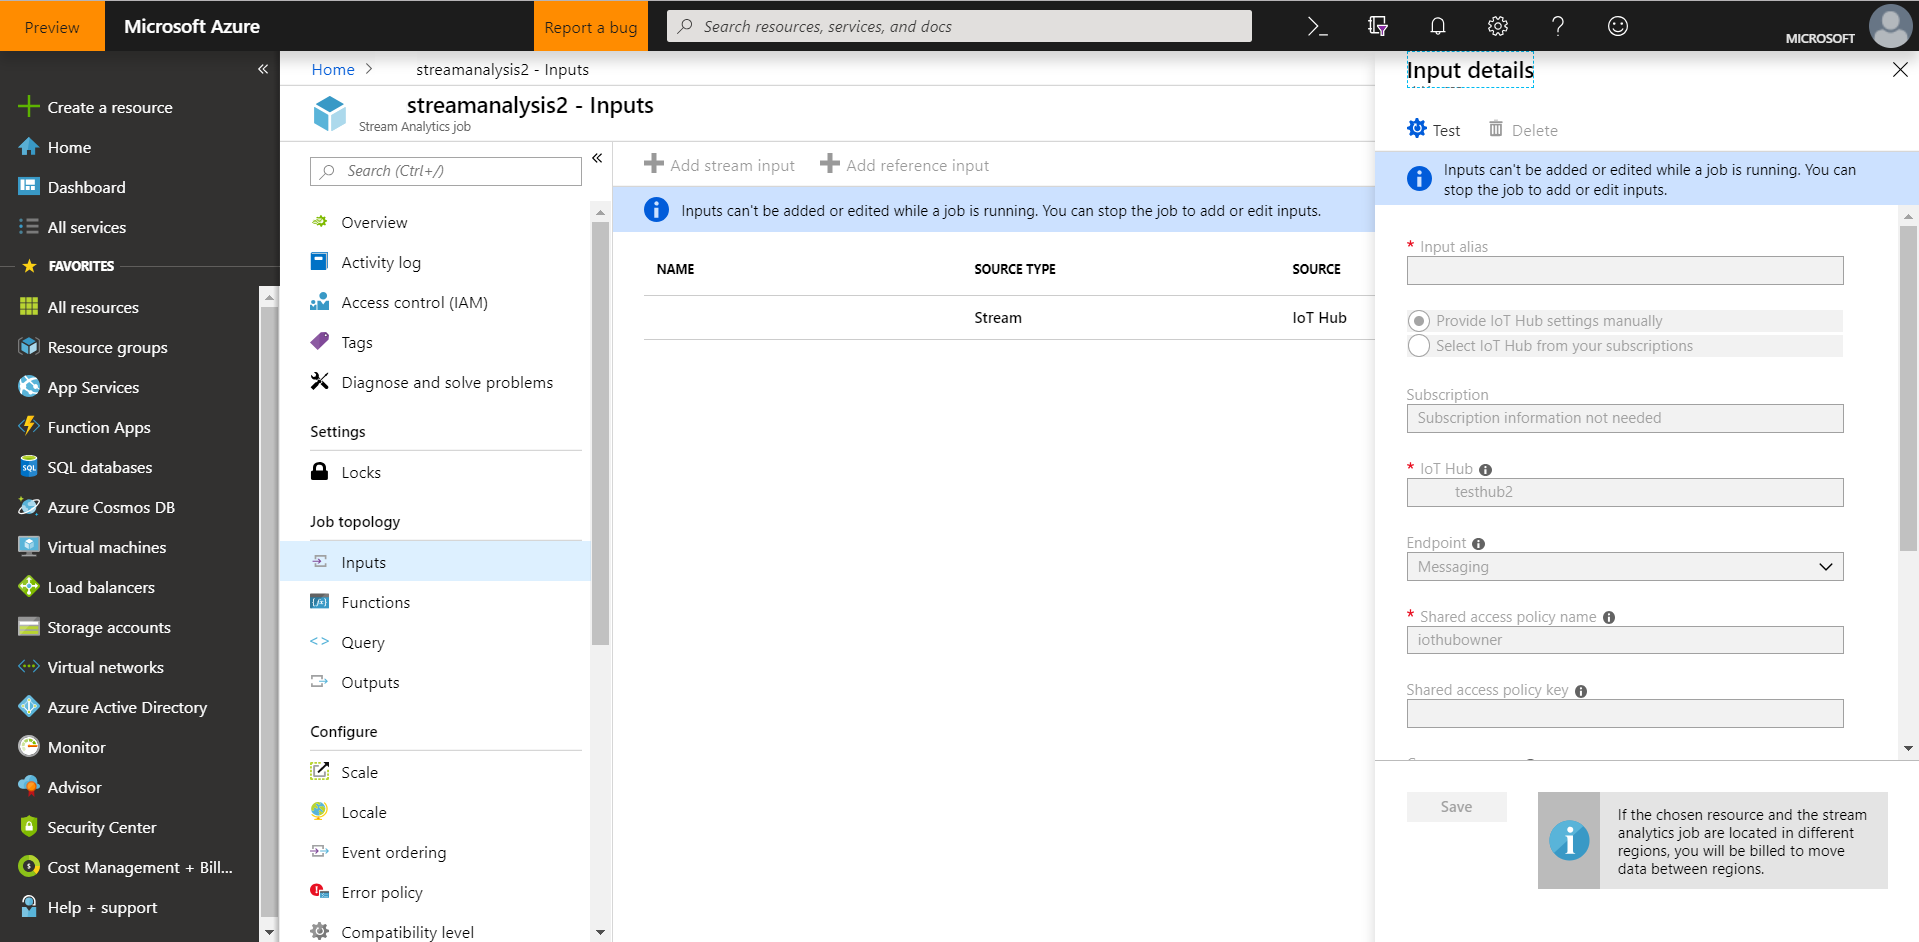
- Under Job Topology, click Inputs.
In the Inputs pane, click Add, and then enter the following information:
Input alias: The unique alias for the input.
Source: Select IoT hub.
Consumer group: Select the consumer group you just created.
Click Create.
Add an output to the Stream Analytics job
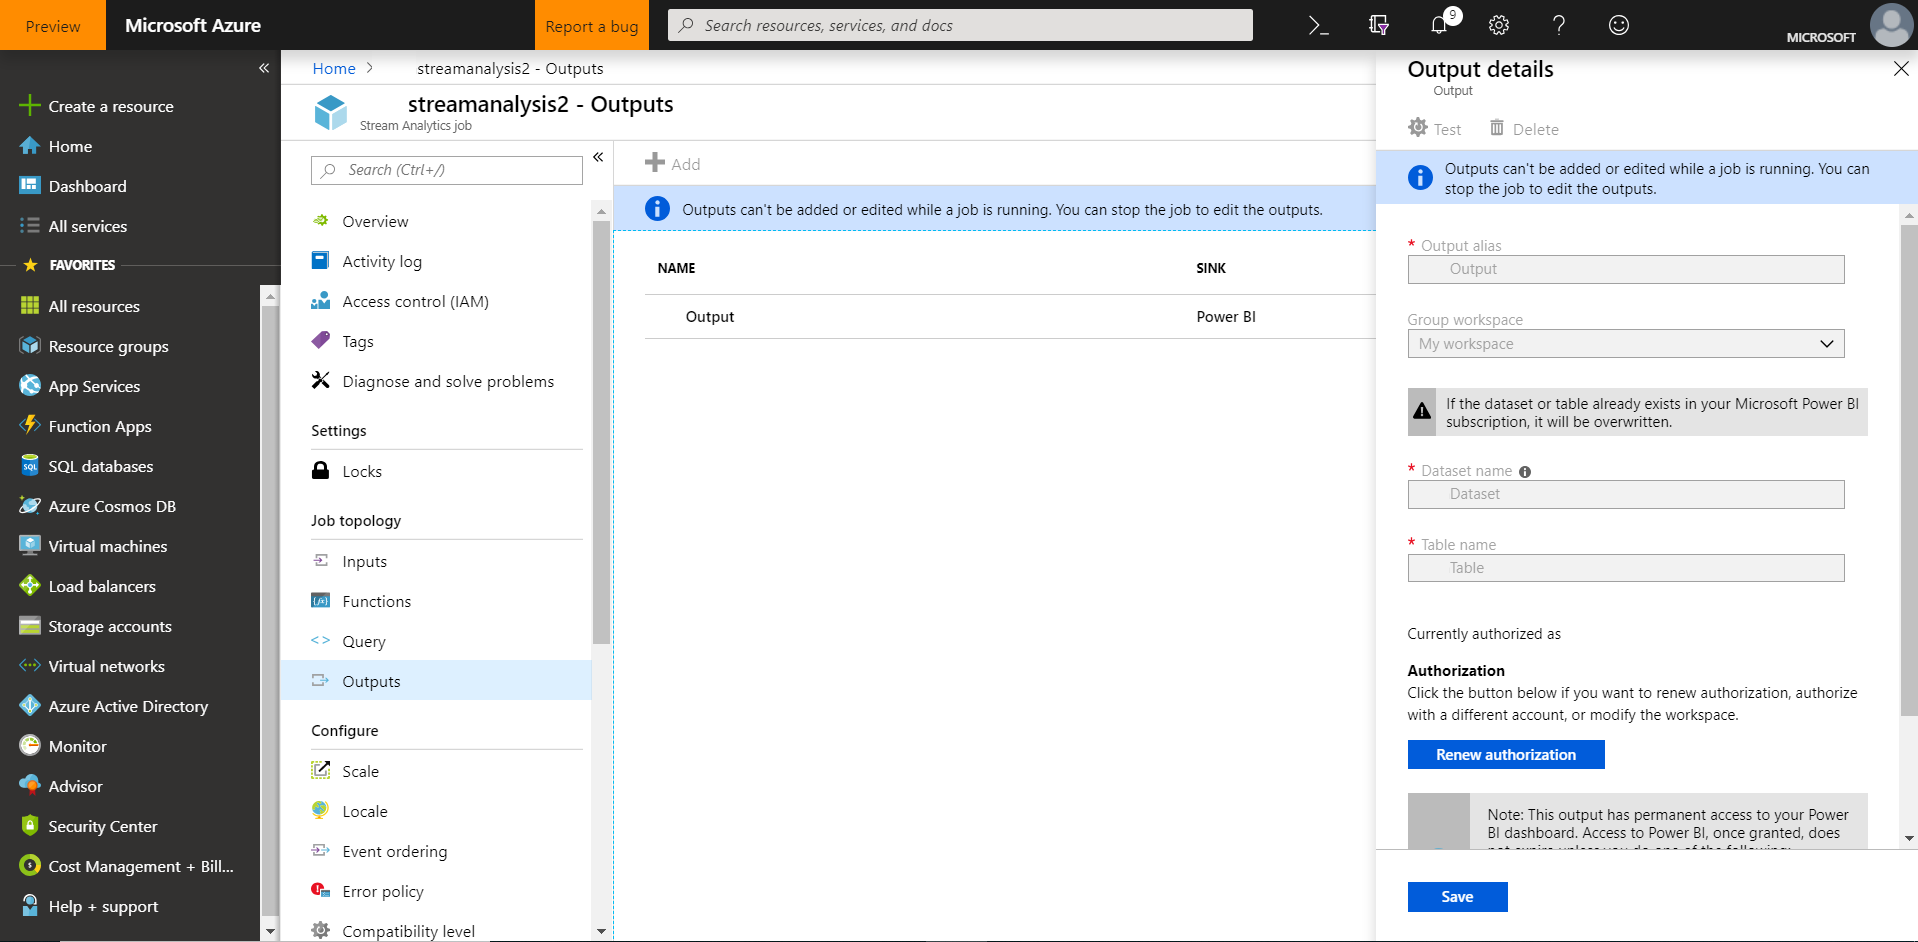
- Under Job Topology, click Outputs.
In the Outputs pane, click Add, and then enter the following information:
Output alias: The unique alias for the output.
Sink: Select Power BI.
- Click Authorize, and then sign into your Power BI account.
Once authorized, enter the following information:
Group Workspace: Select your target group workspace.
Dataset Name: Enter a dataset name.
Table Name: Enter a table name.
Click Create.
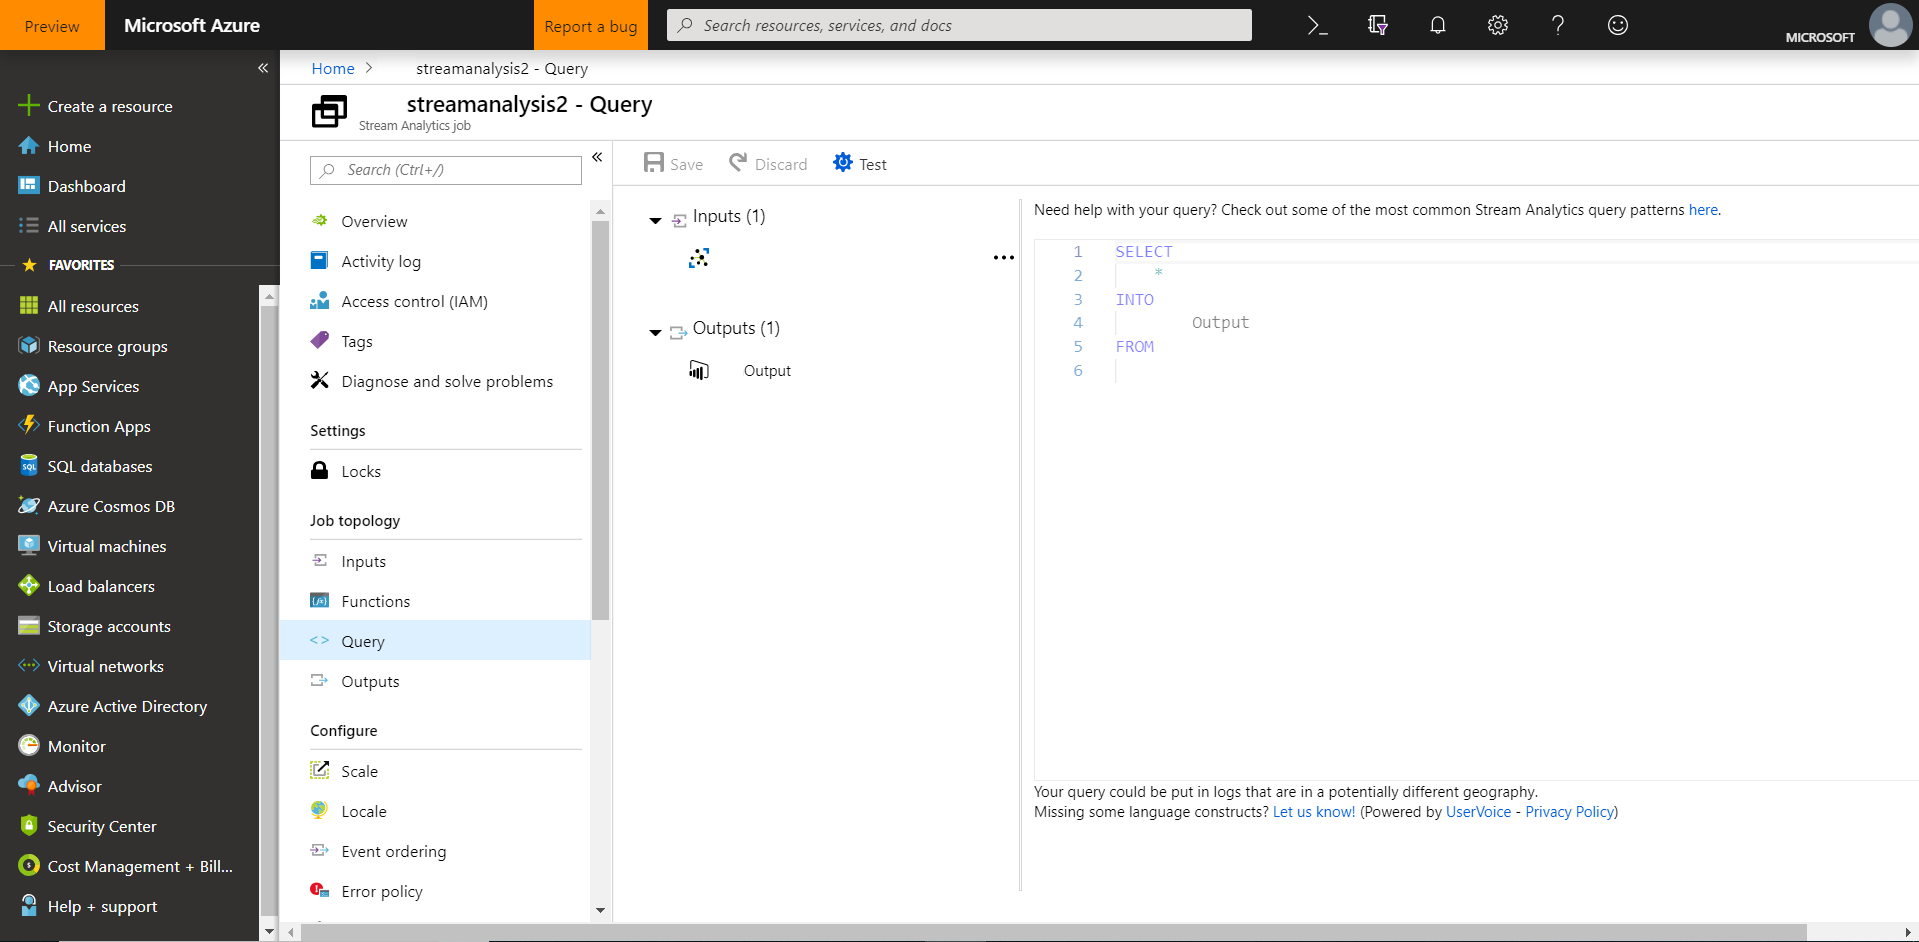
Configure the query of the Stream Analytics job
- Under Job Topology, click Query.
- Replace
[YourInputAlias]with the input alias of the job. - Replace
[YourOutputAlias]with the output alias of the job. Click Save.
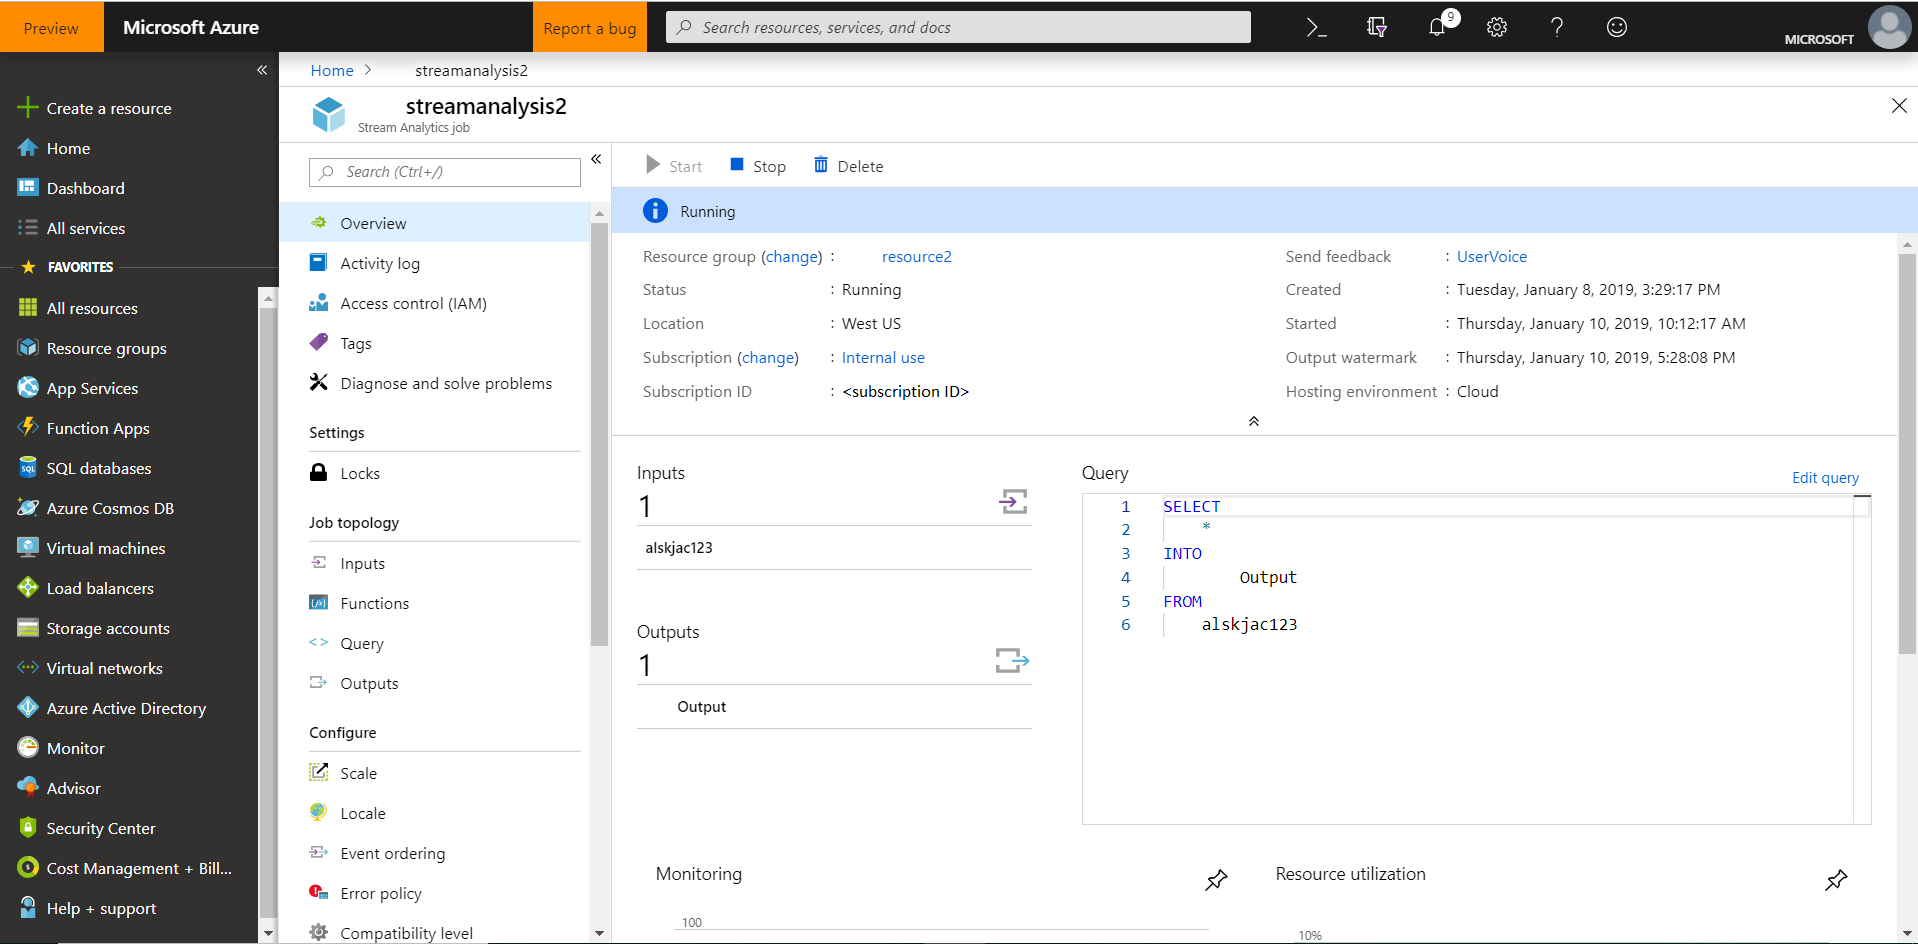
Run the Stream Analytics job
In the Stream Analytics job, click Start > Now > Start. Once the job successfully starts, the job status changes from Stopped to Running.
Create and publish a Power BI report to visualize the data
- Ensure the sample application is running on your device. If not, you can refer to the tutorials under Setup your device.
- Sign in to your Power BI account.
- Go to the group workspace that you set when you created the output for the Stream Analytics job.
Click Streaming datasets.
You should see the listed dataset that you specified when you created the output for the Stream Analytics job.
Under ACTIONS, click the first icon to create a report.
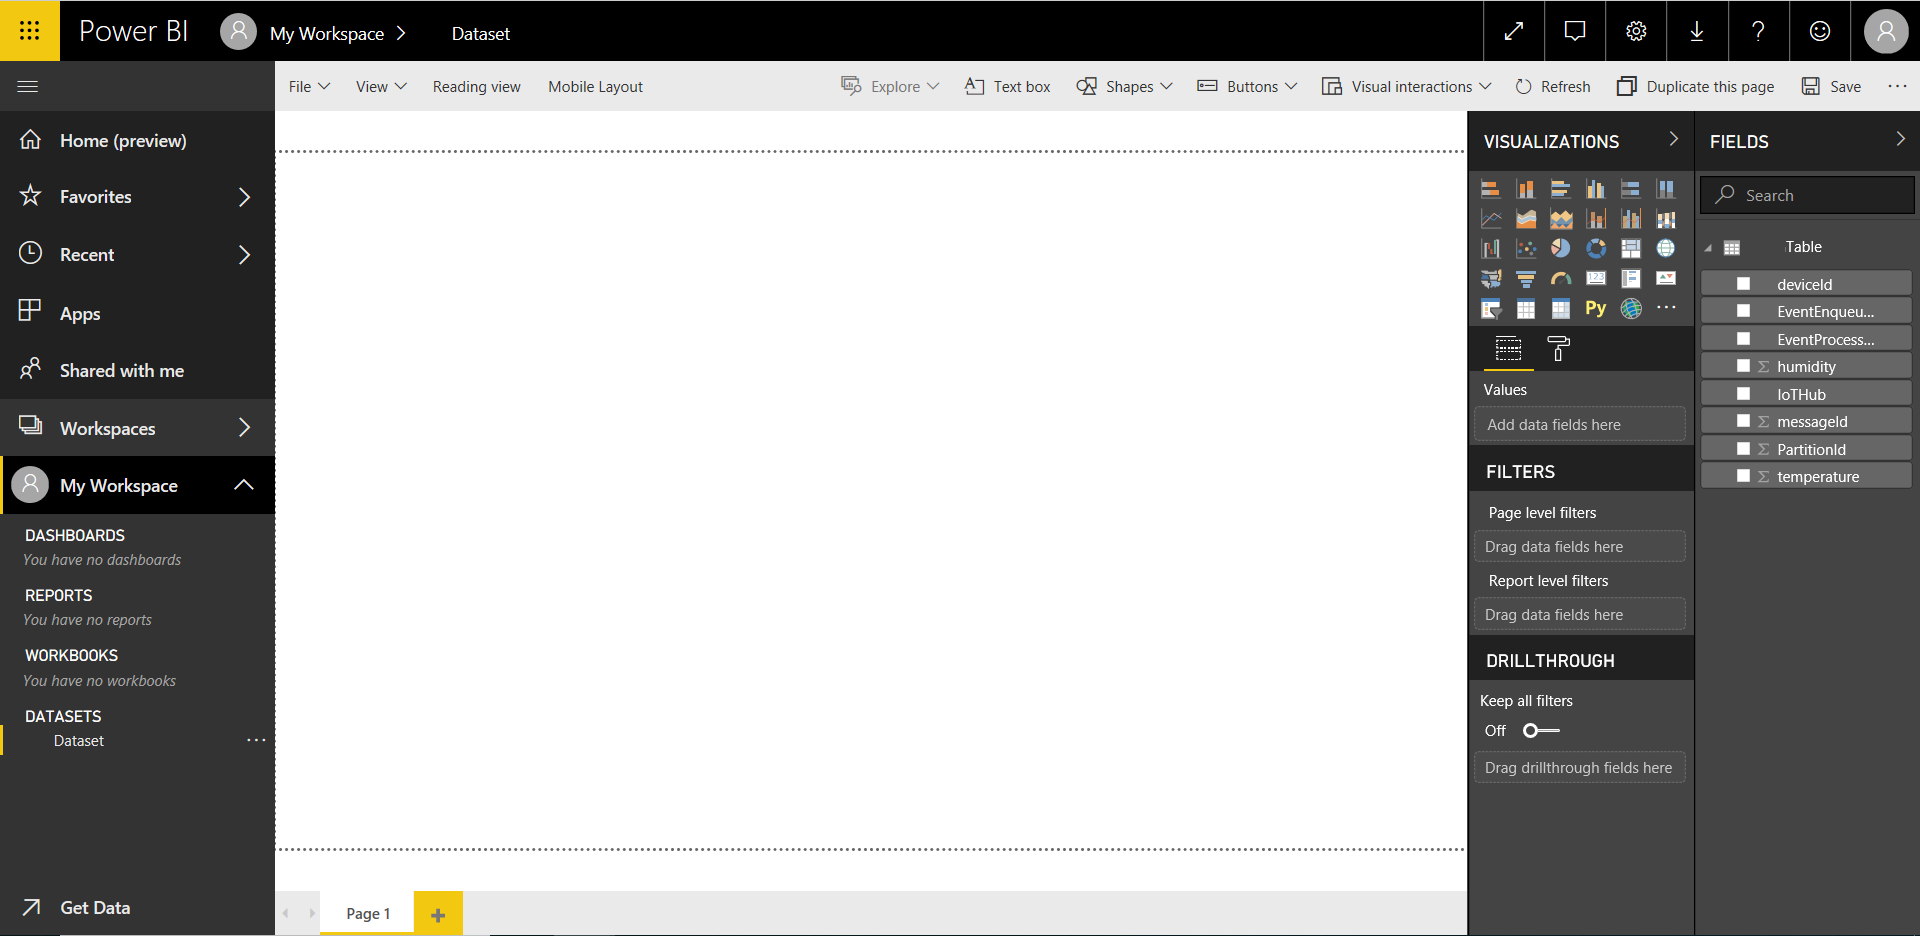
Create a line chart to show real-time temperature over time.
- On the report creation page, add a line chart.
- On the Fields pane, expand the table that you specified when you created the output for the Stream Analytics job.
- Drag EventEnqueuedUtcTime to Axis on the Visualizations pane.
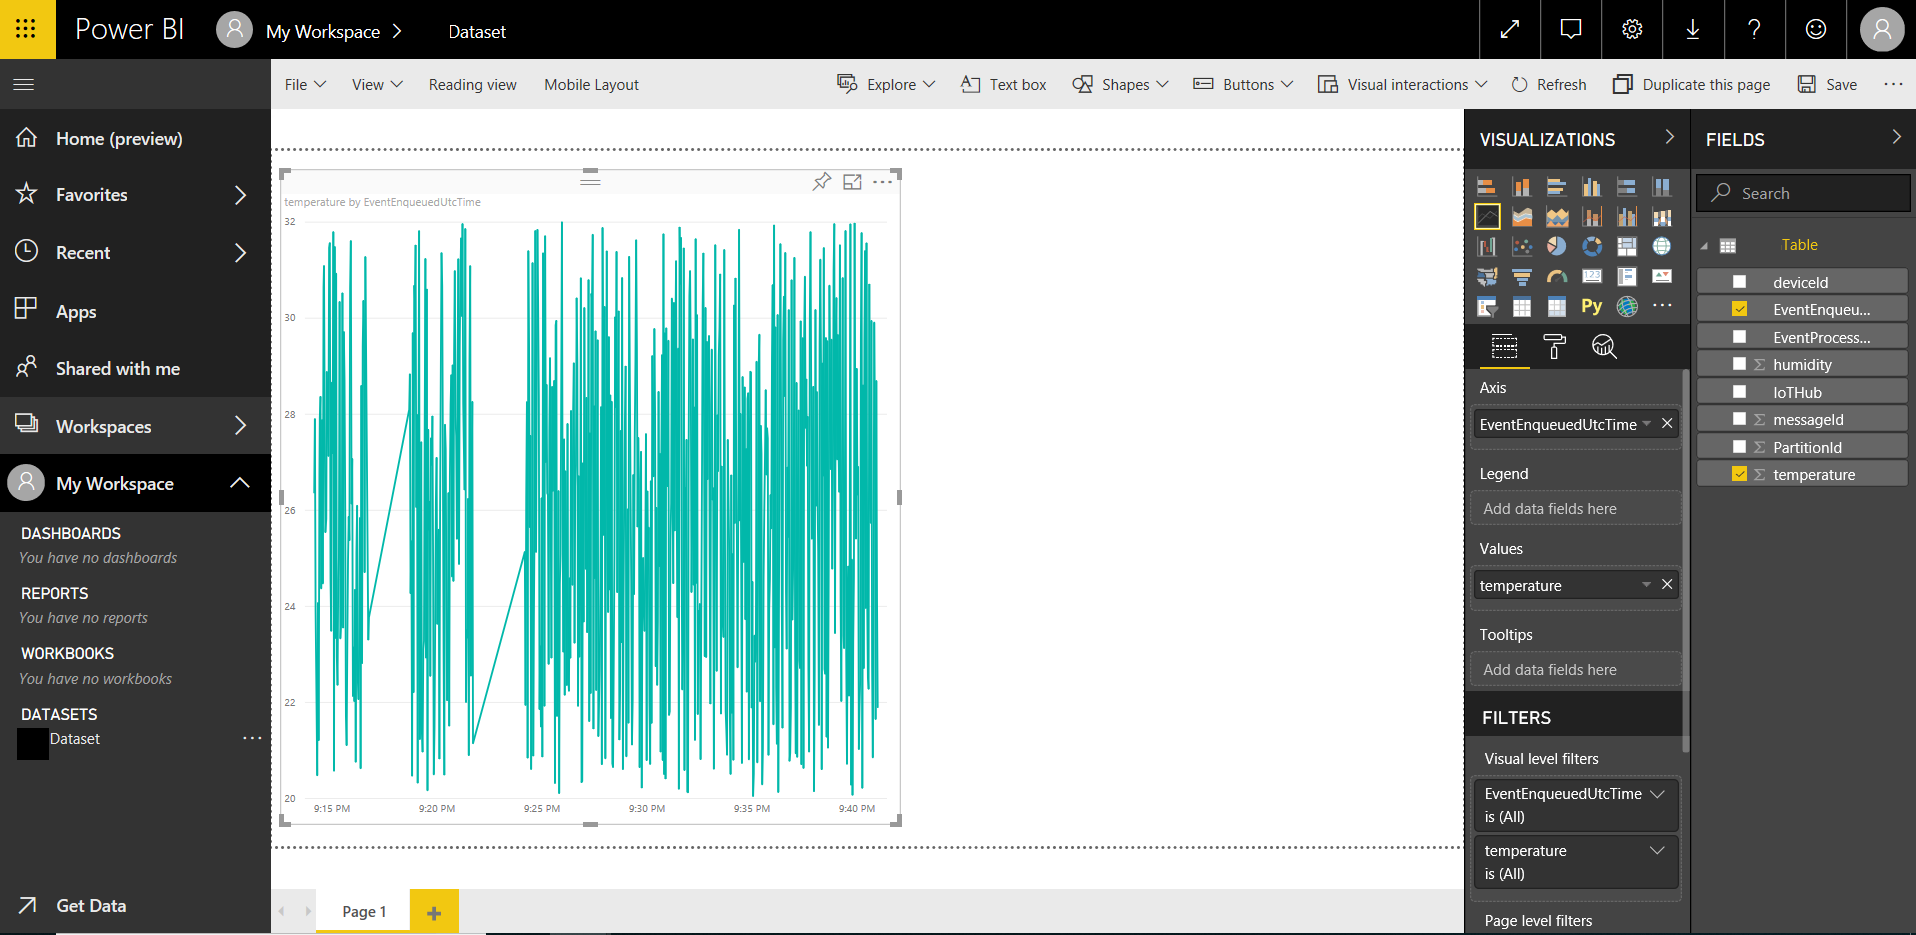
Drag temperature to Values.
Now a line chart is created. The x-axis of chart displays date and time in the UTC time zone. The y-axis displays temperature from the sensor.
Create another line chart to show real-time humidity over time. To do this, follow the same steps above and place EventEnqueuedUtcTime on the x-axis and humidity on the y-axis.
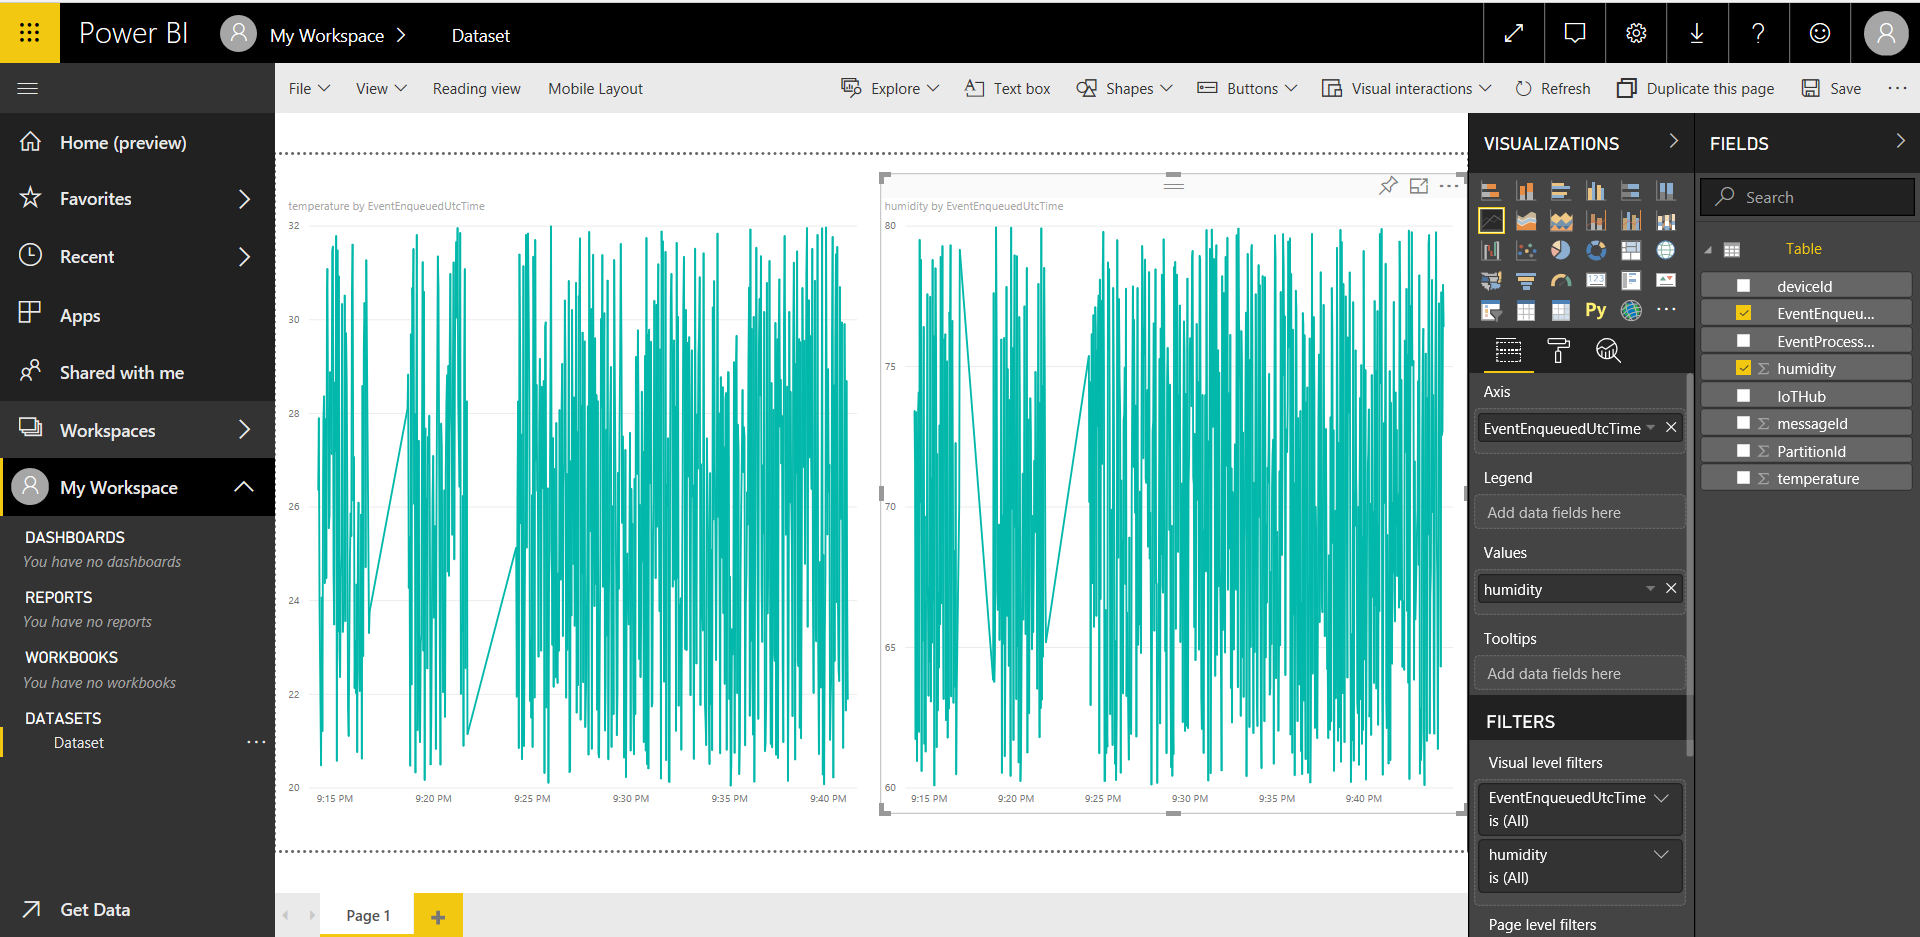
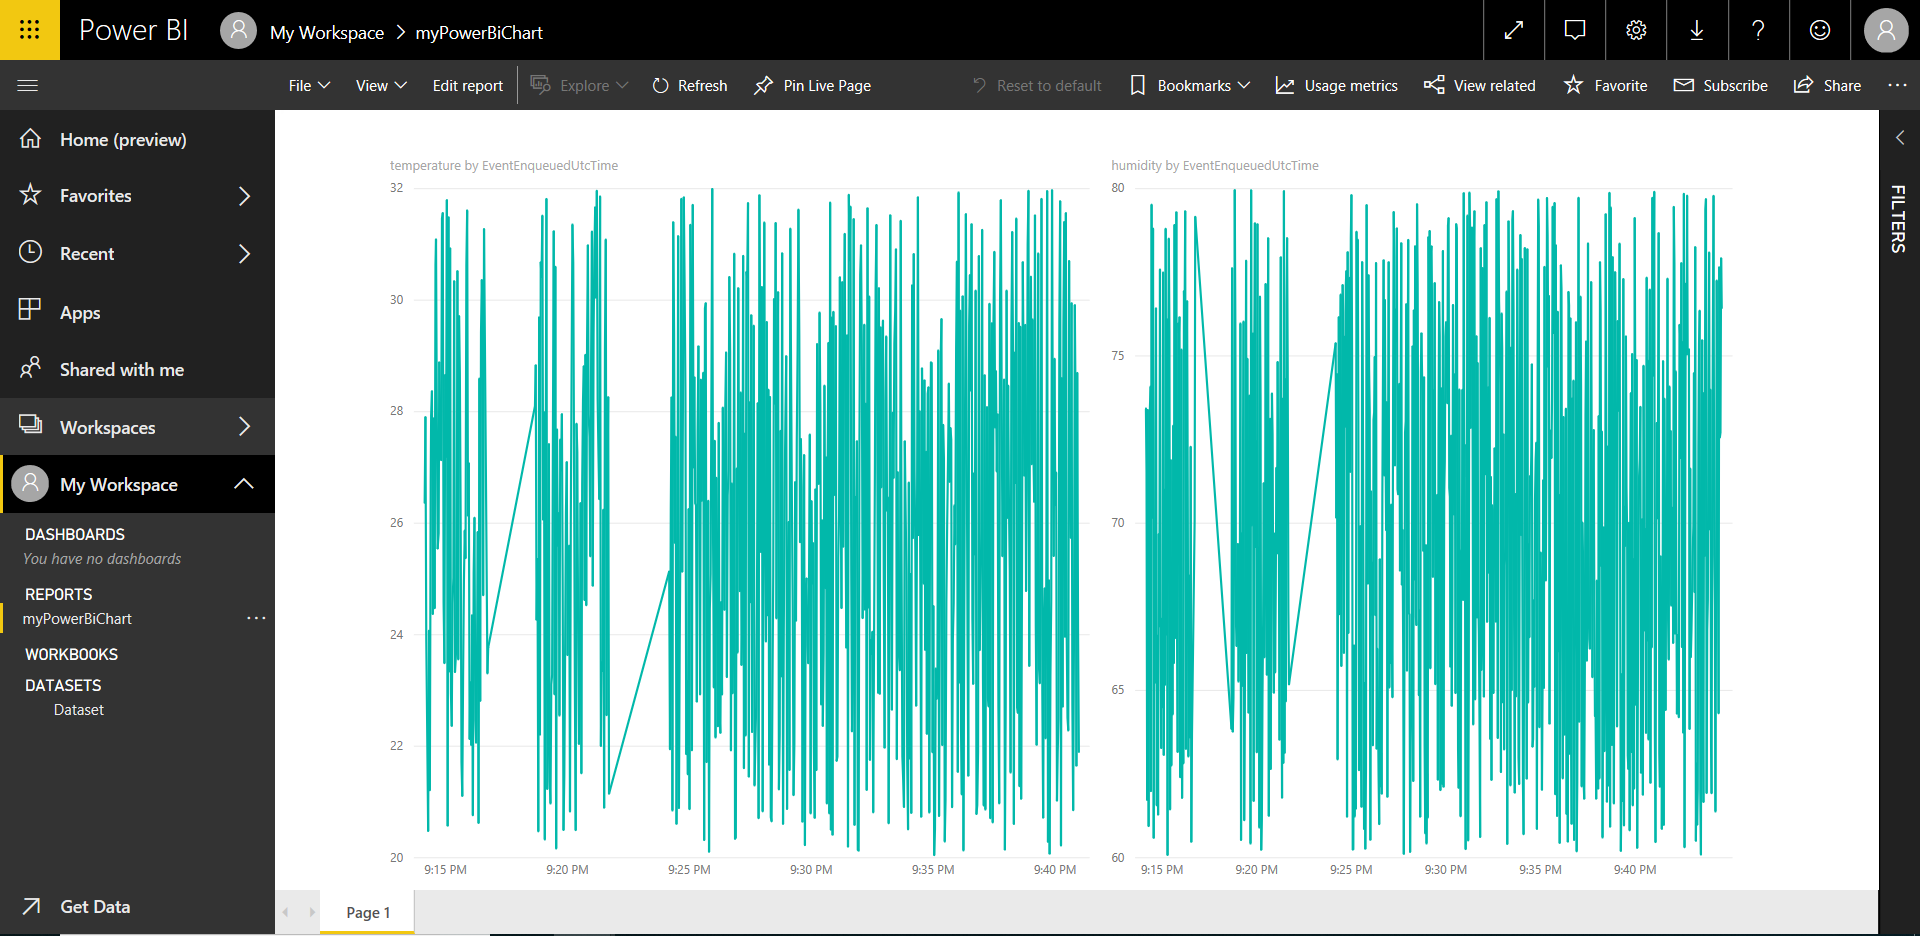
Click Save to save the report.
- Click File > Publish to web.
- Click Create embed code, and then click Publish.
You're provided the report link that you can share with anyone for report access and a code snippet to integrate the report into your blog or website.
Microsoft also offers the Power BI mobile apps for viewing and interacting with your Power BI dashboards and reports on your mobile device.
Next steps
You’ve successfully used Power BI to visualize real-time sensor data from your Azure IoT hub. There is an alternate way to visualize data from Azure IoT Hub. See Use Azure Web Apps to visualize real-time sensor data from Azure IoT Hub.